For those of you with an overnight pulse oximeter you know that one of the highlights of these devices are the readings that get conveniently sent to your phone or computer.
The app or software organizes your overnight oximetry readings for you and creates tables and graphs all for you to share with your physician.
But what if you can’t wait for your next appointment with your physician?
In Need for a New Pulse Oximeter?
Let me tell you about the Wellue O2Ring – it’s like the superhero of pulse oximeters, seriously!
One of the coolest things about it is that it doesn’t just clip onto your finger like your average oximeter.
Nope, it’s a smart ring that you wear on your finger, making it super comfortable and convenient.
You won’t even feel like you’re wearing anything special, yet it’s working its magic behind the scenes.

Table of Contents
Overnight Oximetry Readings How?
Interpreting overnight oximetry readings yourself can be difficult if you’re not some sort of healthcare professional, so here I aim to help you better understand your results.
Referring to the image on the right, see my explanations below of each of the results provided by your overnight pulse oximeter.
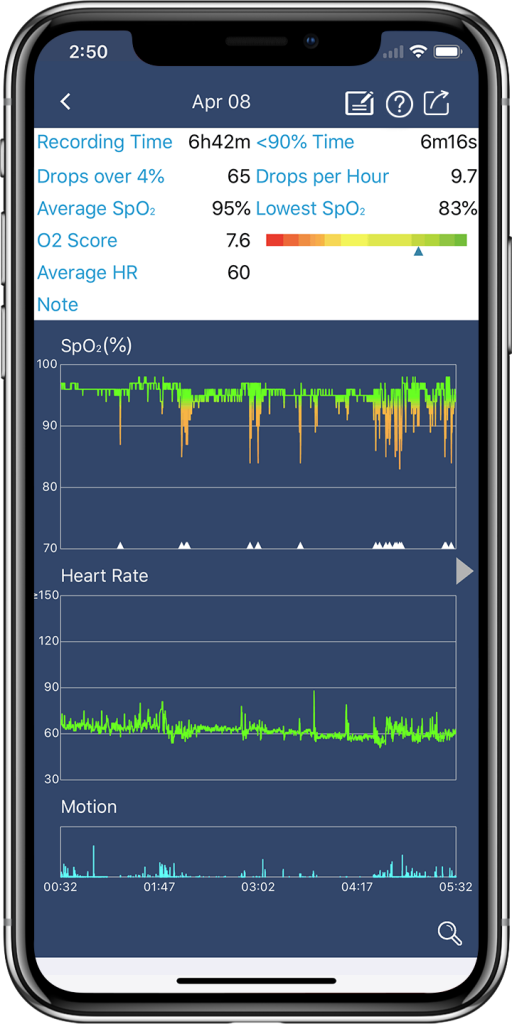
- Recording time: the length of time you used the pulse oximeter to collect readings.
In other words, from the time you put it on and start it to the time you take it off. - <90% Time: the length of time your peripheral oxygen saturation (SpO2) dropped below 90%.
A value of 90% is used here because drops in SpO2 below 90% are when you get into the moderate (80-89%) and severe (below 80%) oxygen desaturation ranges. - Drops over 4%: the number of times your SpO2 decreased by 4% or more. These drops are indicated as the small white triangles at the bottom of the SpO2 graph.
Unless you changed the presets, these are the times when your pulse oximeter vibrated throughout the recording session to let you know your oxygen level dropped below normal range. - Drops per Hour: the average of the number of times your SpO2 decreased by 4% or more per hour throughout the recording session.
Essentially, this could be seen as the average number of times you experience notable oxygen desaturation per hour.
If you have sleep apnea, you can also look at this as your Apnea Hypopnea Index (AHI). - Average SpO2: overall average of your SpO2 readings gathered throughout the recording session.
- Lowest SpO2: the lowest SpO2 reading gathered throughout the recording session.
- O2 Score: the overall assessment of oxygen shortage throughout the recording session. It is a combined assessment of frequency, depth, and duration of drops in oxygen saturation.
This score ranges from 0-10, with a higher score meaning that the blood is the most saturated with oxygen (in other words, the higher your score on the range of 0-10, the better).
The O2 Score correlated with the bar to the right of it that changes from red to yellow to green. Wellue states that if you fall in the yellow or red, you should notify your physician. - Average HR: overall average of your heart rate reading gathered throughout the recording session. Normal heart rate is generally between 60-100 beats per minute (bpm); most healthy adults have a resting heart rate of below 90 bpm.
My Final Words
The accuracy of pulse oximeters can vary from brand to brand and device to device. If you have the Wellue O2 Ring, I would say it’s as accurate as these devices can get.
If your SpO2 falls between 80-99%, SpO2 can be off by about +/- 2%. If your SpO2 falls between 70-79%, then SpO2 can be off by about +/- 3%.
Still looking to learn more about pulse oximetry?
Do you have sleep apnea and want to learn more about how pulse oximetry is used in sleep apnea? See my articles below: